Introduction
This project involved retrofitting our Cessna Project with higher voltage components for NASA testing. They were interested in determining the transient impact of a coupled electrical system on a turbine engine, and selected us to acquire this data. My particular contribution involved making the board and writing the software for a variable load, fabricating the harnesses, integrating everything into the system, and compiling data.
Electrical System Overview
The electrical system is comprised of a full bridge rectifier, 20 ceramic resistors, 20 relay boards to handle the switching of the resistors, and a control board that interfaces with each relay board. The entirety of the DC system is fused, as well as each individual resistor. An accompanying computer program was written to accept a power input expressed in either watts or as a percentage of total capacity and deliver an appropriate resistor combination to the control board over CAN or I2C. Fifteen of the twenty ceramic resistors are 150 ohms, while the remaining five are 68 ohms. This combination allows for a peak power output of 30.25-kW at 550-V, and 31.76-kW when the system is operating at 400-V. These numbers are only realizable in the event that all resistors are engaged and the electric generator is spinning at maximum RPM for its given pulley. Additionally, the 68 ohm resistors are only utilizable with the 400-V pulley. This is a consequence of the fact that the ceramic resistors are rated for 2500-W, and this threshold is exceeded at 412 volts.
 Early development of resistor bank
Primary Control Circuit
If you feel inclined to inspect them for yourself, you can find my code here, and my PCB files here. Otherwise, here is a brief overview of the control board and its code as well as a few pictures.
The board and its corresponding schematic pages are divided into three sections: the primary microcontroller, gate drivers, and supporting circuity such as power supplies and connectors. The microcontroller was initially selected to communicate with a CAN transceiver chip over UART, but I decided to simply use I2C to receive instructions from an external controller. In any case, the main controller receives a single message with the first four bits containing the quantity of 150 ohm resistors to activate, the next most significant three containing the quantity of 68 ohm resistors to activate, and the most significant bit containing the desired status of the test LED. The controller receives this message at least once every three seconds, otherwise it enters a safety mode in which all relays are opened and the load is disconnected. Once the board successfully receives the control message, it checks against the memory of the gate drivers to determine if relays need to be opened or closes. This data is obtained through an SPI request that makes the gate drivers send the status of their outputs back to the host controller. If the resistor quantity requested matches that found within the combination of all three gate drivers, no action is taken. Otherwise, the main controller will communicate with the three gate drivers over SPI to either power or remove power from their respective relay coils. For example, if a message arrives at the main control board requesting that 10 150ohm resistors be activated along with 3 68ohm resistors, and there aren’t any active at the time of reception, the main controller will command that no more than one of each resistor type be enabled than one per second until the desired quantity is obtained. The reverse is true for this process, meaning that only a single resistor of each type is turned off per second.
 All schematic pages in one image. Open Individually
The top most section of the board contains the three gate driver chips along with the connector which allows them to interface with their corresponding relay boards, the middle section contains the primary controller and its supporting devices, while the bottom contains the I2C connector, 24 volt input, 5 volt buck converter, and the controller programming connector.
 Board file with pours omitted
Test Data
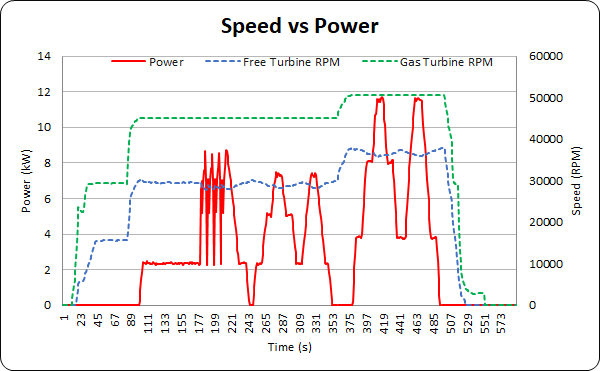
Our test matrix involved reaching and maintaining a particular throttle percentage then stepping through electrical load percentages according to the following scheme: [0-25,25-50,50-75,75-50,50-25,25-75,75-25,25-0]. This matrix was repeated at throttle percentages of 60,70,80, and 90 percent. However, as can be seen in the graphs below, we had to divide our test into two sections as we faced CAN communication issues after our 70 percent throttle run. The first two graphs show the relationship between turbine speeds and electrical power generation.
 Speed vs. Power for 60 and 70 Percent Throttle
Residual communication issues can be seen at the start of the 80 and 90 percent graphs. These issues manifested in four rapid power spikes that abated once we reconnected the control computer and restarted the test.
 Speed vs. Power for 80 and 90 Percent Throttle
The below electrical characteristic graphs appear convoluted at first glance, but understanding what they convey becomes simple upon the realization that power in kilowatts is multiplied by 100, while current is multiplied by 10. Power, voltage, and current are associated with the left vertical axis, while only the generator speed is on the right axis.
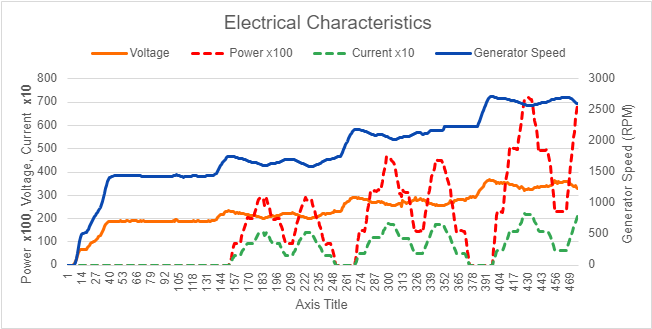 Electrical Characteristics for 60 and 70 Percent Throttle
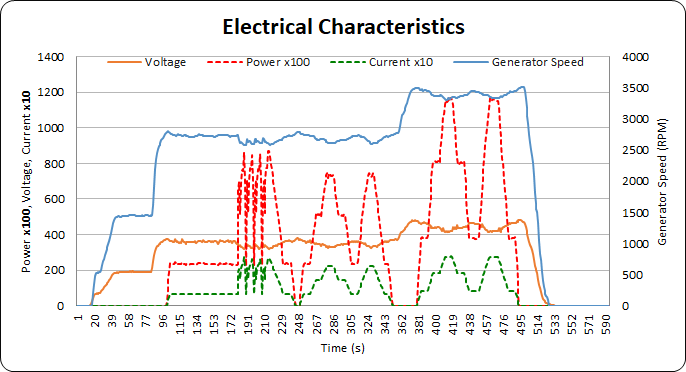 Electrical Characteristics for 80 and 90 Percent Throttle